KQL primer
QuartzIQ allows you to create control activities that use KQL (Kusto Query Language), a language similar to SQL, in order to generate new alerts. You can also visualize data contained in the datasources configured in each control perimeter by using the Data Workbench module.
This article will give you a high level understanding of KQL, and will provide you details on the most used operators in KQL, the statement types and the setting of FunctionalIDs and EventFunctionalIDs (necessary for KQL scripts in control activities). At the end of this article, you will also find complete and practical examples of KQL queries.
Common KQL operators FunctionalID and EventFunctionalID Alert rule examples
Common KQL operators
Table
The main step in any query and the easiest one is the source table you want to use in your query.
The Data Sources you can refer to in your query are the ones that were approved in your Control Perimeter. Refer to the Control Perimeter article, section Add/Modify Data Source, to learn more on this.
In order to try out using KQL, you can either work in an alert rule in the Edit Mode, or in the Data Workbench. In this article, we will be showing the Data Workbench that you can access using the option in the side menu (you must be a Data Manager in at least one Control Perimeter in order to view the option).
Data Workbench
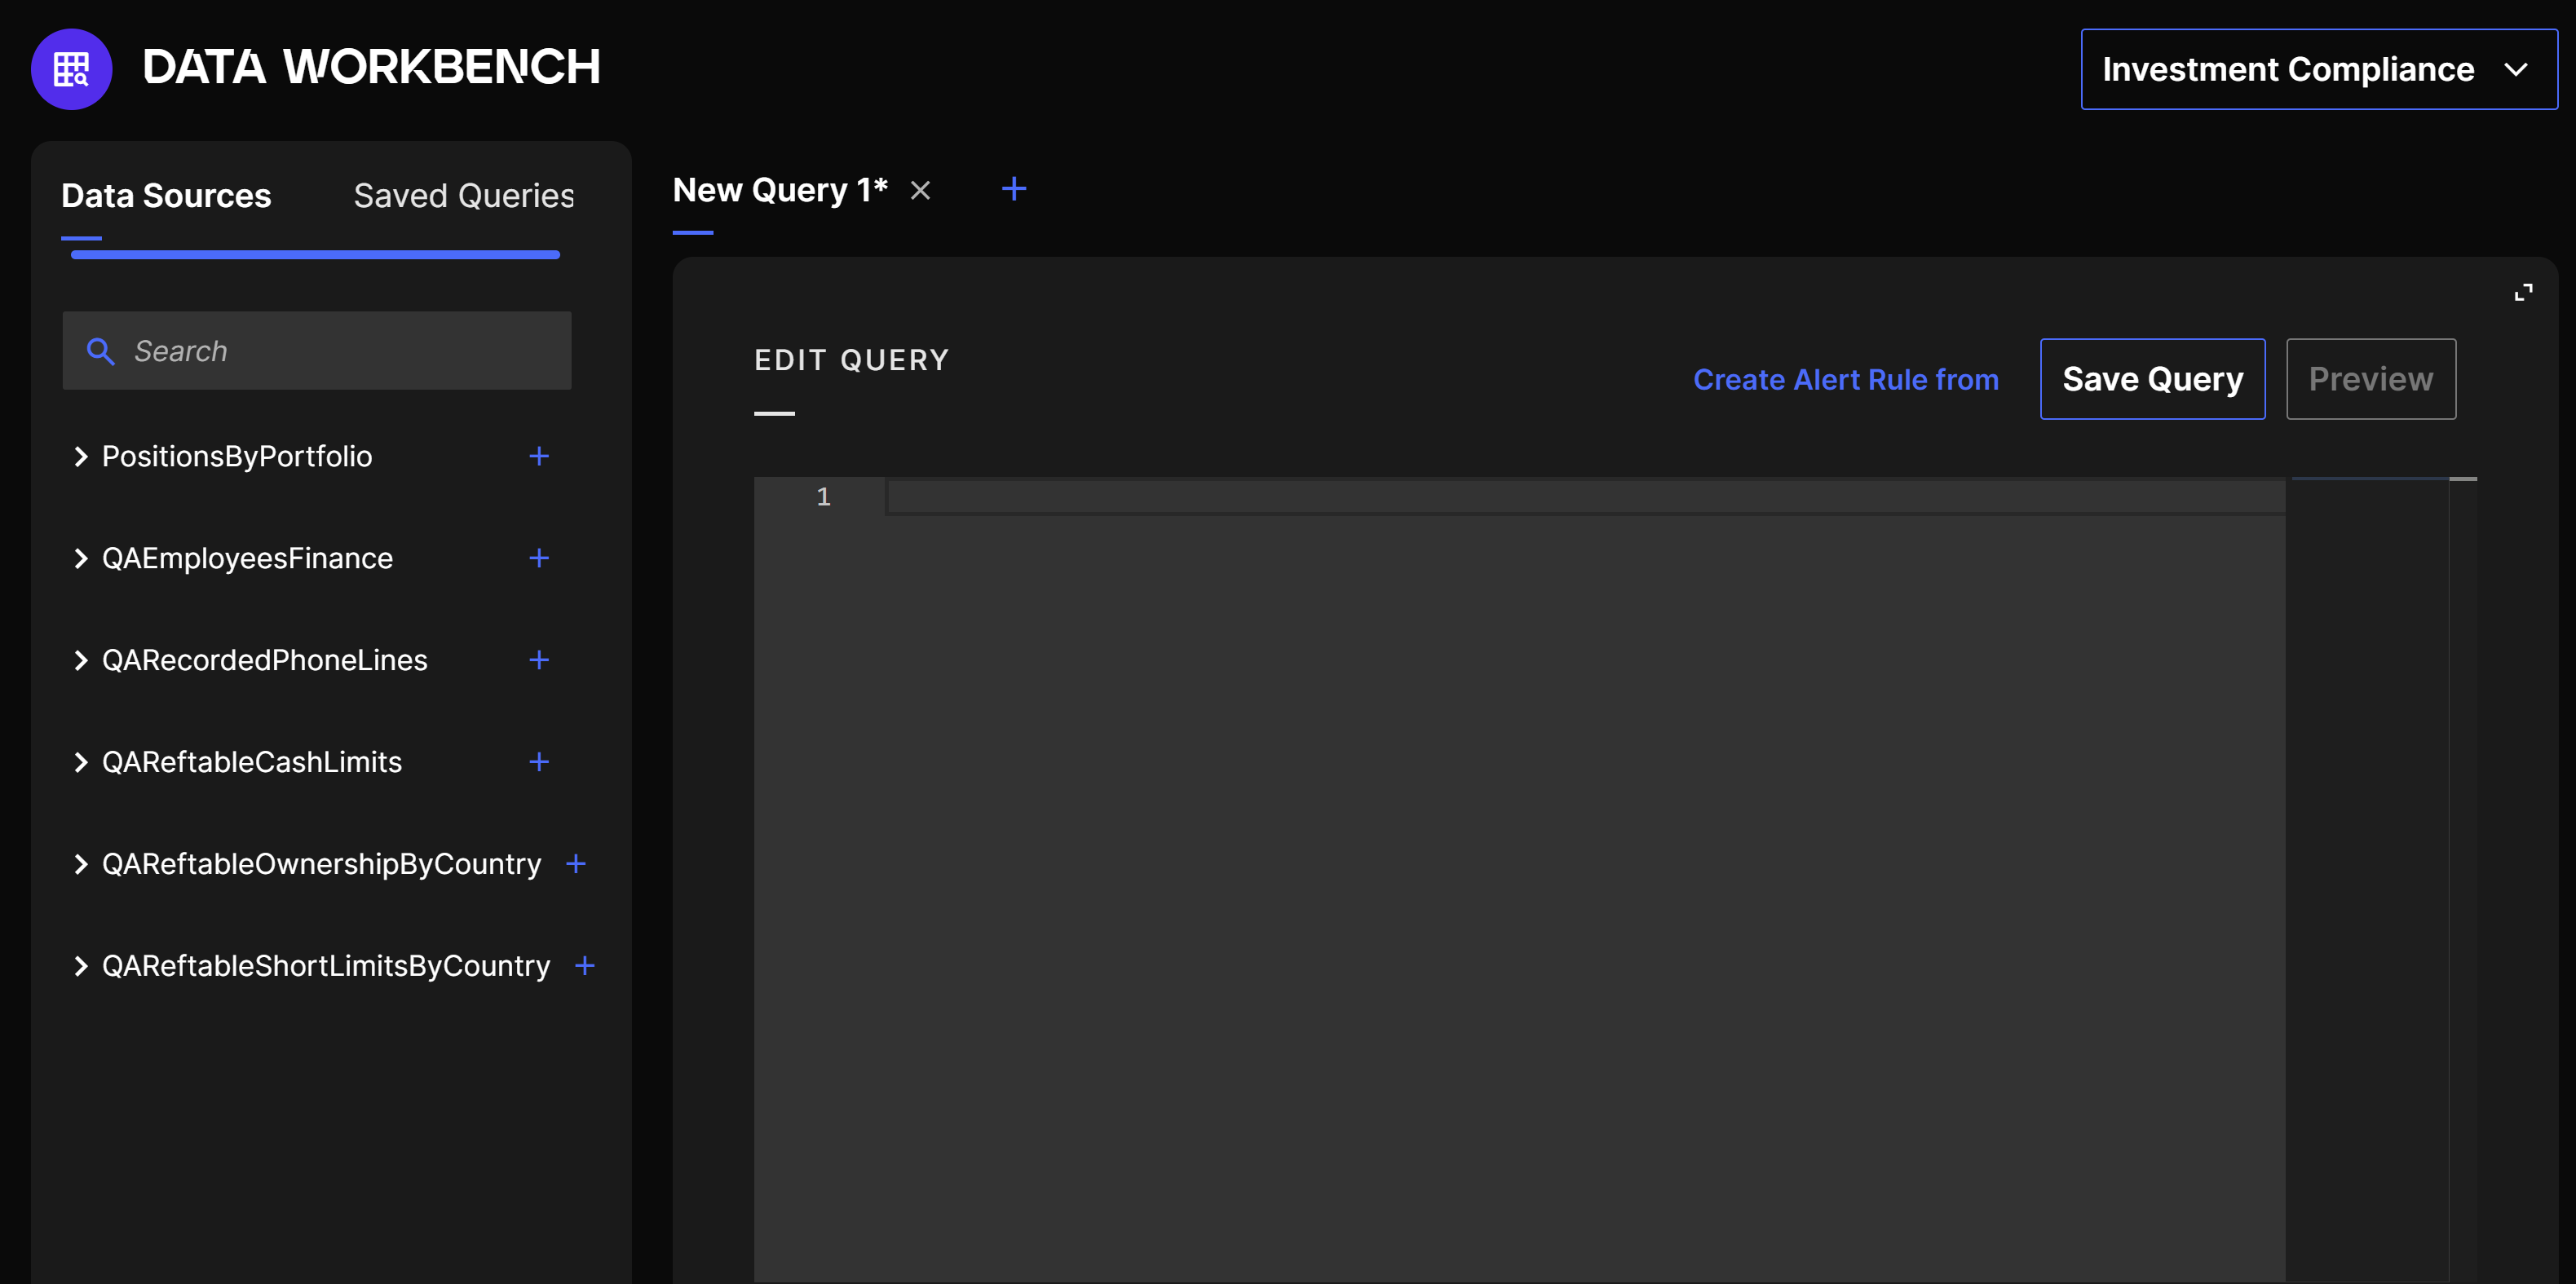
You can select the Control Perimeter in which you want to do your tests and then click on the table you want to display in the list of Data Sources on the left:
Table in Data Workbench
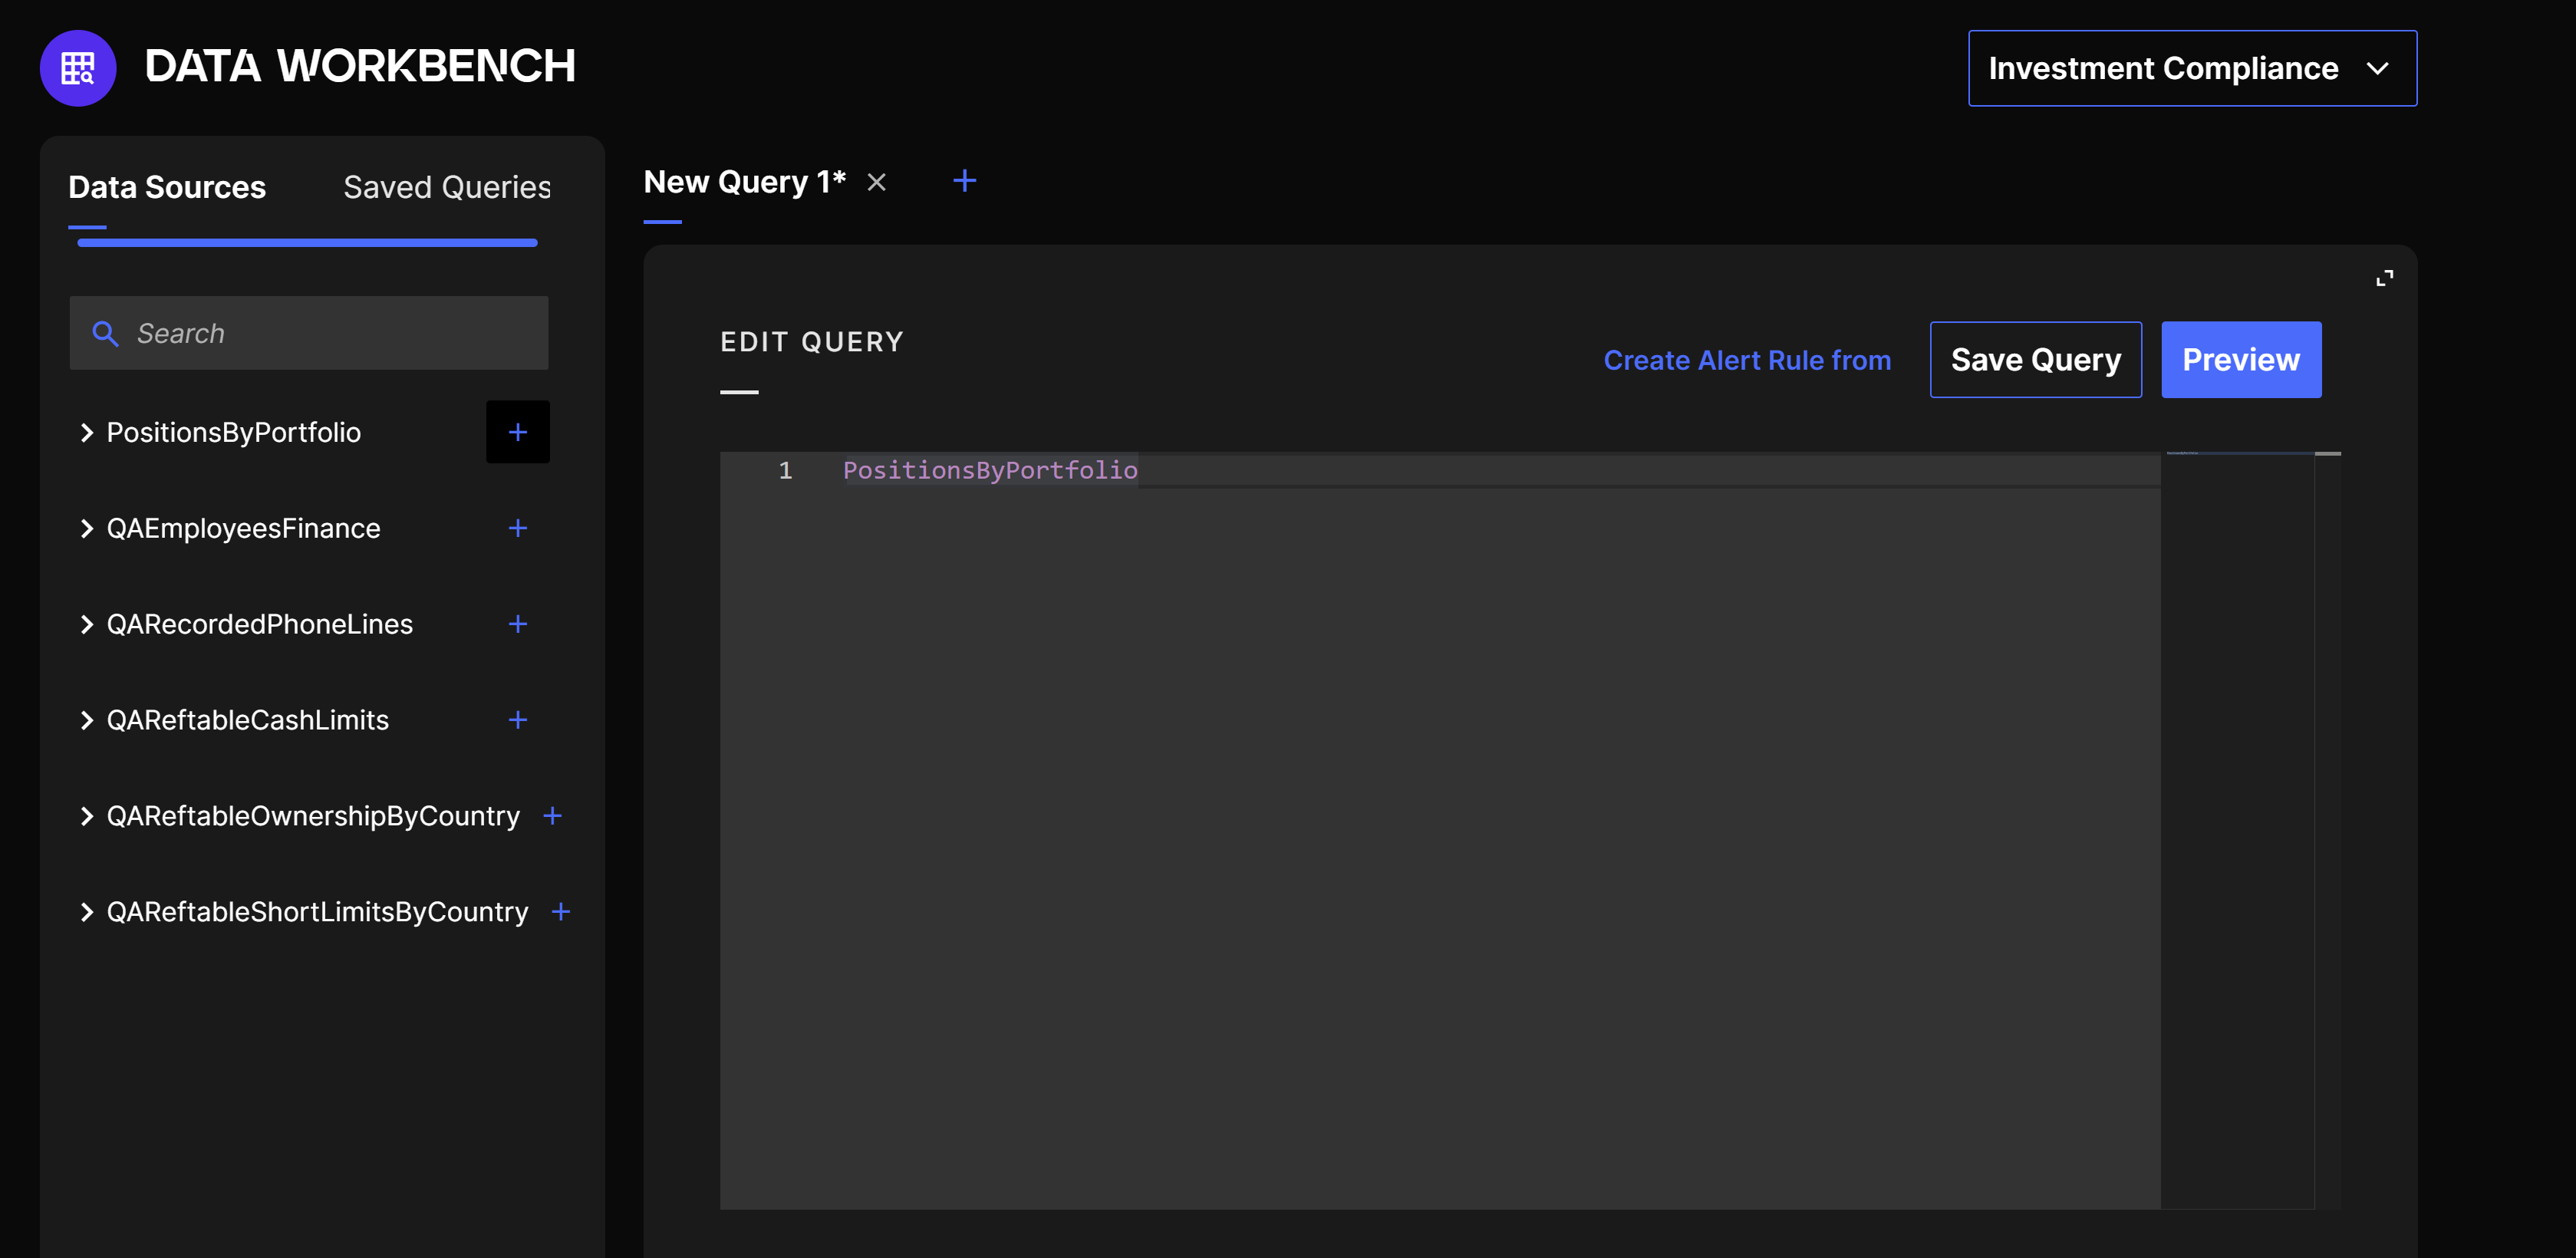
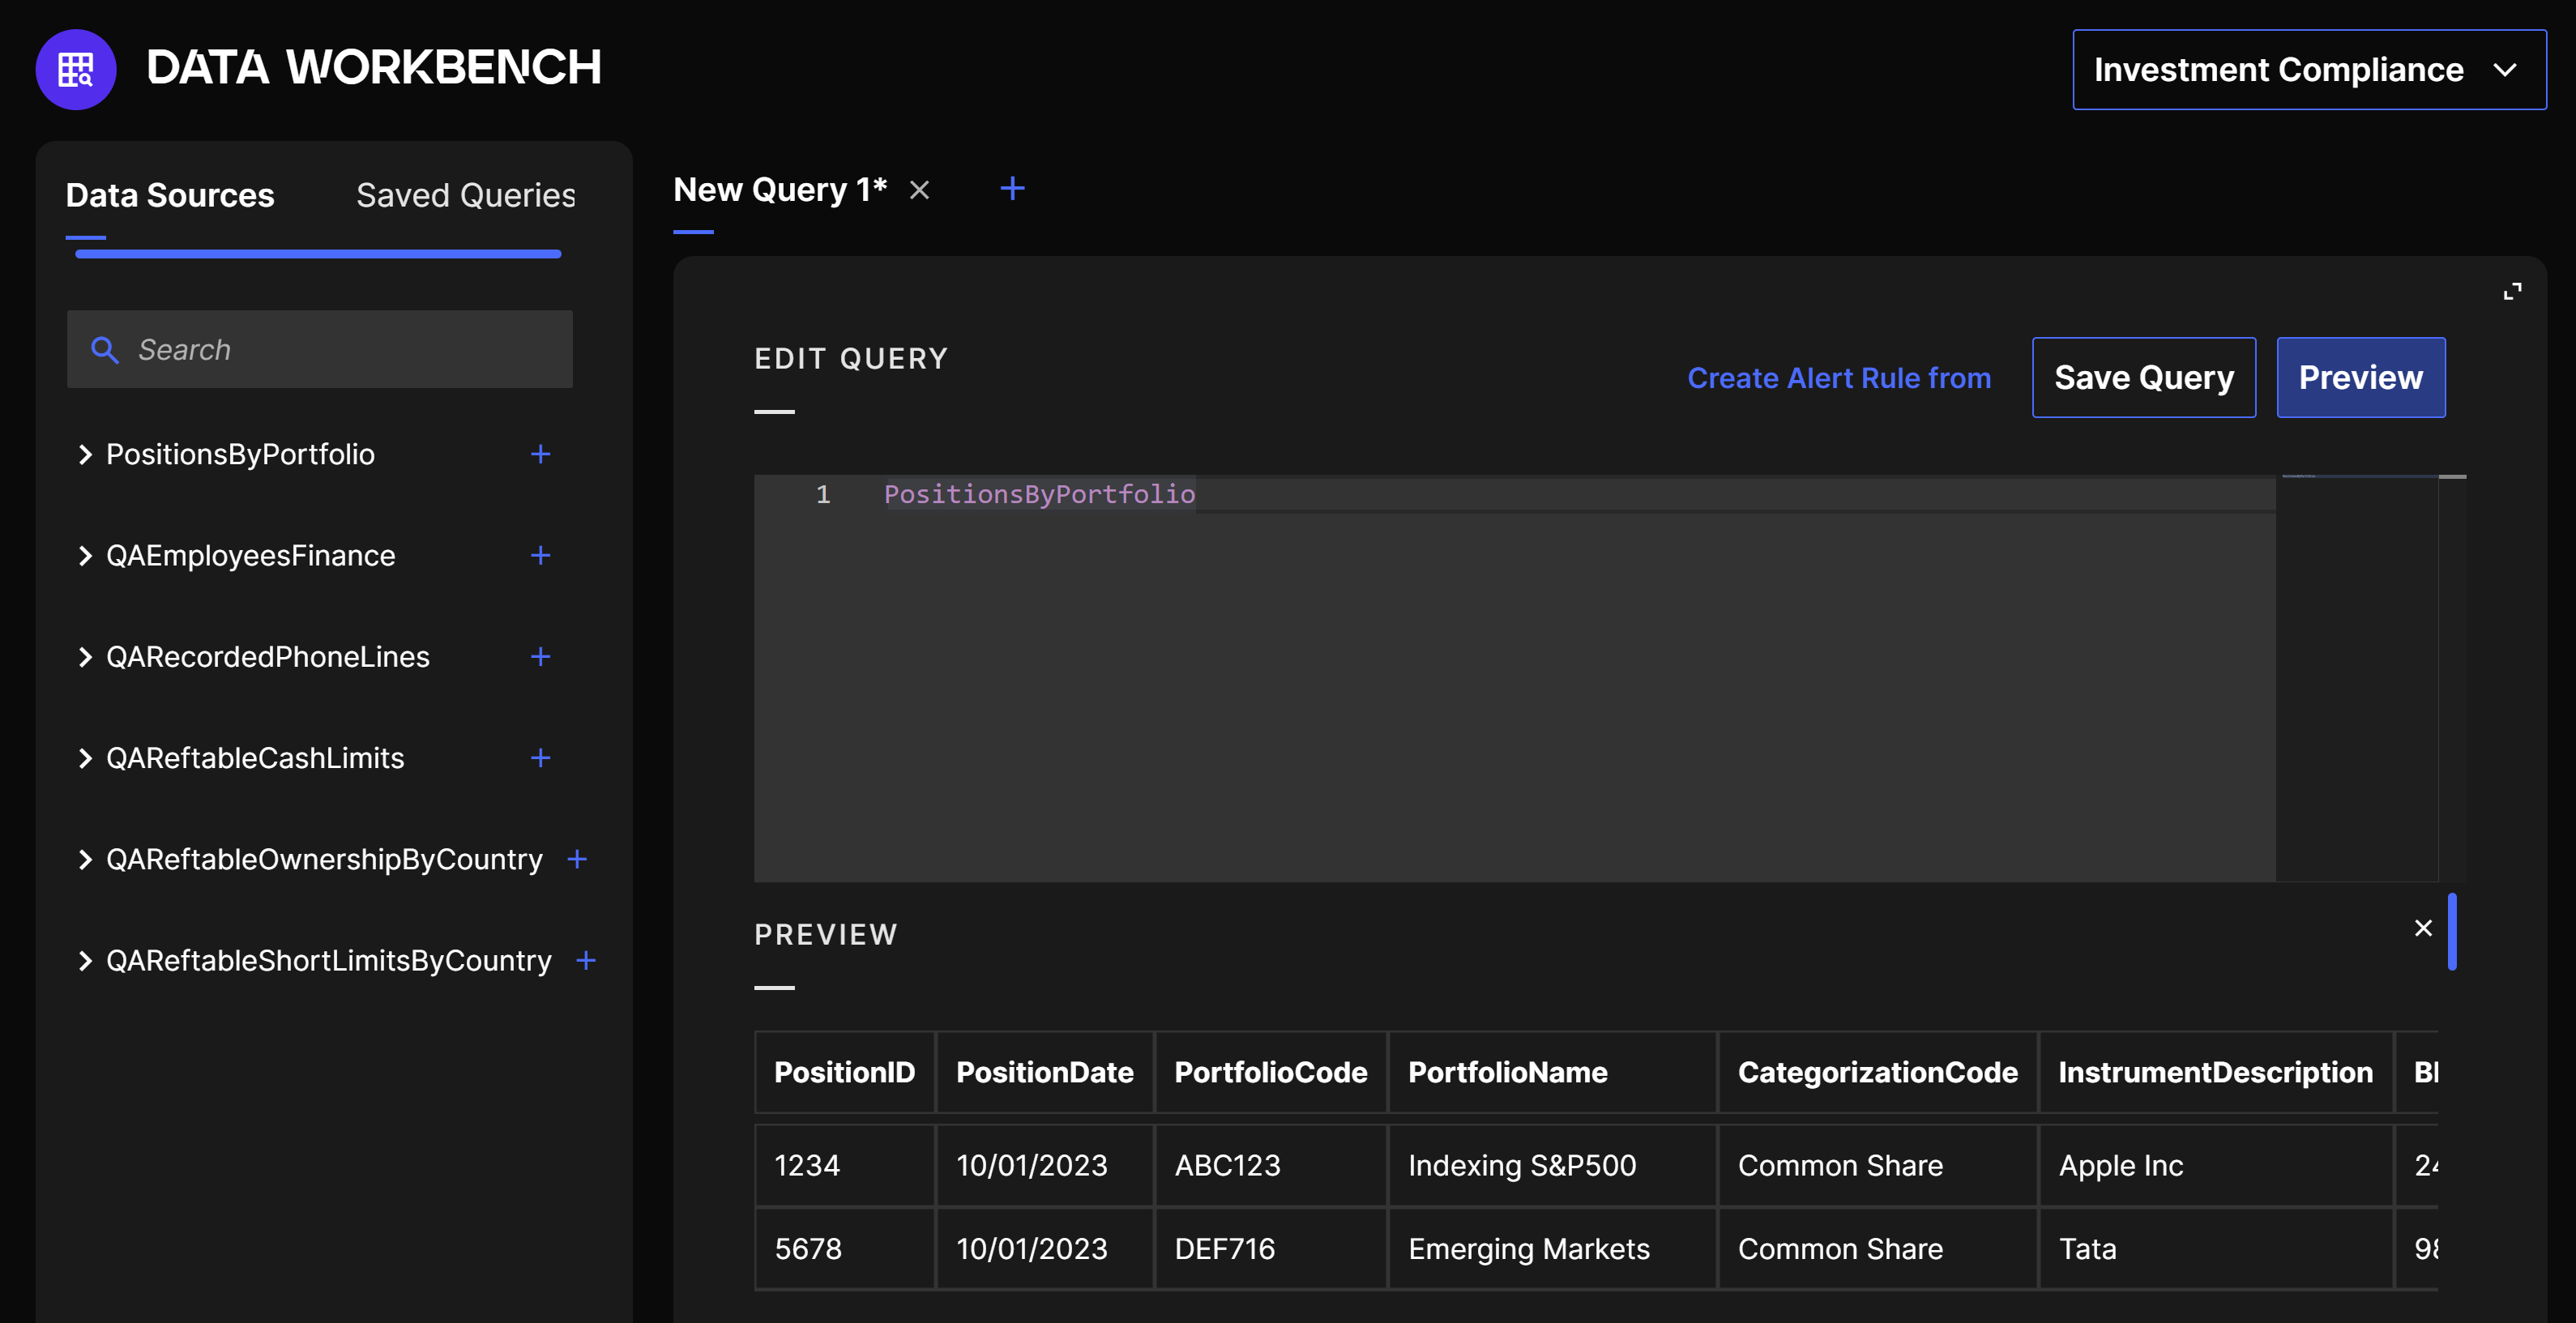
The Data Source is then added to the query. You just need to click on Preview to see the result, which is the full table:
Workbench Preview
Extend
The extend operator allows you to add new calculated columns to the results
Syntax Table | extend calculated columns
Example:
Table1
| extend Total = Column3 + Column4
In this example, all of the columns of the Table1 will be displayed + the column Total.
With extend you add columns, which is different from project, that select displayed columns. You can combine extend and project operators. Their results are then close but it can make your code clearer.
Example:
Table1
| project BusinessUnit, AprilResultsColumn, MayResultsColumn, JuneResultsColumn
| extend SpringResults = AprilResultsColumn + MayResultsColumn + JuneResultsColumn
Where
The where operator allows you to filter the rows you want to display by setting a condition. You can give multiple conditions with and separators.
Syntax Table | project columns | where condition(s)
Example:
Table1
| project Column1, Column3, Column4, Column5
| where Column1 == "Right" and Column3 > 20
In order to set your filters you can use string operators. The most common ones are the following:
| Operator | Filter function | Example |
|---|---|---|
| == | Equals | where column1 == "Right" and column2 == 25 |
| != | Not equals | where column1 != "Wrong" |
| contains | The row contains the word or part of word you are looking for, with a argument that is not case-sensitive | where column1 contains "GHt" |
| contains_cs | Same as contains but case sensitive | where column1 contains "ght" |
| in | Equals to any of the elements, case-sensitive | where column1 in ("OK", "Right", "Validated") |
| in~ | Same as in but not case-sensitive | where column1 in~ ("ok", "rigHT", "ValiDATeD") |
Note that "!" at the beginning of every string operator allows you to look for its opposite.
!= : not equals
!contains : does not contain
!in : not equals to any of the elements
Join
The join operator allows you to create a new table composed of the merged rows of two tables. The merge is made by matching values of specified columns from each table.
Syntax
RightTable | join kind=DefineKind LeftTable on $left.ColumnInRightTable == $right.ColumnInLeftTable
or
RightTable | join kind=definekind LeftTable on ColumnThatExistsinBothTables
Example:
Table1
| join kind=rightouter Table2 on $left.col1 == $right.col2
You can merge these tables in different ways by defining the kind of join you want to use. The most common kind is inner (kind=inner) that returns all matching records from left and right sides. The other kinds are anti, semi and outer, associated with the side of the table you want to set as main table. Please note that the right table is considered as the outer table, while the left one is the inner table.
Here are the various output results for the different types of Joins:
| Kind | Results |
|---|---|
| kind=leftanti | Returns all the records from the left side that don't have matches from the right |
| kind=rightanti | Returns all the records from the right side that don't have matches from the left |
| kind=innerunique | Only one row from the left side is matched for each value of the on key. The output contains a row for each match of this row with rows from the right |
| kind=leftsemi | Returns all the records from the left side that have matches from the right |
| kind=rightsemi | Returns all the records from the right side that have matches from the left. |
| kind=fullouter | Returns all the records for all the records from the left and right sides. Unmatched cells contain nulls. |
| kind=leftouter | Returns all the records from the left side and only matching records from the right side. |
| kind=rightouter | Returns all the records from the right side and only matching records from the left side. |
Project
The project operator allow you to display specific columns of your tables, to rename them and to insert new computed columns.
Syntax Table | project columns
Example:
Table1
| project Col1, Col3, ColA = Col4
To display multiple columns you only need to separate them with commas and list them in the order you want them to appear.
If you want to rename a column in the results, use the = sign Example :
| project NewColumnName = OriginalColumnName
You can also make various operations before displaying your columns. Example:
| project SpringResults = AprilResultsColumn + MayResultsColumn + JuneResultsColumn
Summarize by
The summarize operator is very diverse and can be pretty complex to code but it allows you to make a powerful use of your data and it can be useful in many cases. We give you here a summary of its main usages. The summarize operator creates a new table from the aggregation of content of your input table.
Unique combination You can first find unique combinations of keys in your table with a simple summarize by.
Table | summarize by column1, column2
Example:
StockTable
| summarize by Product, StockStatus
For each Product you will then see the various current StockStatus that are shown in your StockTable (there are various StockStatus for the same product depending on the stock in each store) :
| Product | StockStatus |
|---|---|
| Product 1 | In stock |
| Product 1 | Less than 10 |
| Product 2 | In stock |
| Product 3 | Less than 10 |
| Product 3 | Out of stock |
Aggregation of filtered values This operator can also allow you to display aggregated values
Table | summarize operation by column
Example:
StockTable
| summarize TotalJanuarySales = sum(JanuarySales) by Product
For each Product you will see the aggregated JanuarySales for all shops. The TotalJanuarySales is not an existing column in the table StockTable, it is only one in the newly issued table created by the summarize operation. You can use many others operators in the summarize by to create aggregation of values, such as count(), countif(), avg(), etc.
Let Statement
There are various types of KQL statements but most of them are used in advanced coding. The most basic one is the let statement.
The let statement allows you to set a variable name equal to a function or expression or to create a view.
With the help of let you can define a variable once and then use it multiple times in your query. You can also break up complex coding into multiple parts that you can identify by a variable.
Please note that you must end every let statement with a semicolon (;)
Example 1:
let AuditedStore = "Shop 1";
let MinSales = 500;
StockTable
| where Shop == AuditedStore and 2022Sales < MinSales and 2021Sales > MinSales
We are taking here the same example as in the Summarize by section. The 2 let statements allows you to define specific variables that will be further used in the query. With this query you will be able to see which product made 2022 sales under 500 units and 2021 sales over 500 units in Store 1.
Example 2:
let 2022SalesByProd = StockTable
| where InventoryStatus == "Done"
| summarize 2022SBP = sum(2022Sales) by Product;

let SalesOver500forInStockProduct = StockTable
| join kind=inner 2022SalesByProd on Product
| where 2022SBP > 500 and StockStatus == "In stock"
| project Store, Product, 2022Sales, Total2022SalesByProduct = 2022SBP;
SalesOver500forInStockProduct
Here with the first let you make a reference to the first table named "2022SalesByProd", that has been created with the summarize by. This table gives you the total quantity of sales in 2022 (all stores included) for each product whose Inventory Status is at Done.
With the second let the second part of the query starts. This part will give you the final results. The join allows to combine the initial StockTable with the newly created 2022SalesByProd table. It is simply like adding a new column to the StockTable. The where filters the results to only see products for which the total 2022 sales are over 500 units and whose Stock Status is In Stock. Finally, with the project operator only some columns are selected for the final display. The 2022SBP column is also renamed "Total2022SalesByProduct" to have more readable results.
It will give this kind of final result:
| Store | Product | 2022Sales | Total2022SalesByProduct |
|---|---|---|---|
| Store 1 | Product 1 | 700 | 700 |
| Store 1 | Product 4 | 400 | 600 |
| Store 1 | Product 7 | 800 | 1000 |
| Store 2 | Product 4 | 200 | 600 |
| Store 3 | Product 7 | 50 | 1000 |
| Store 5 | Product 7 | 150 | 1000 |
FunctionalID and EventFunctionalID
In IQ, it is mandatory to set a FunctionalID and an EventFunctionalID in every query to have functional Alerts and Alert Events.
The EventFunctionalID is the key used to create new Alert Events. Each unique key value will create an Alert Event. On the other hand, the FunctionalID is the key used to group Alert Events into a single Alert.
Alerts are displayed in the Alert and Tasks menu and can be seen directly in each Alert Rules:
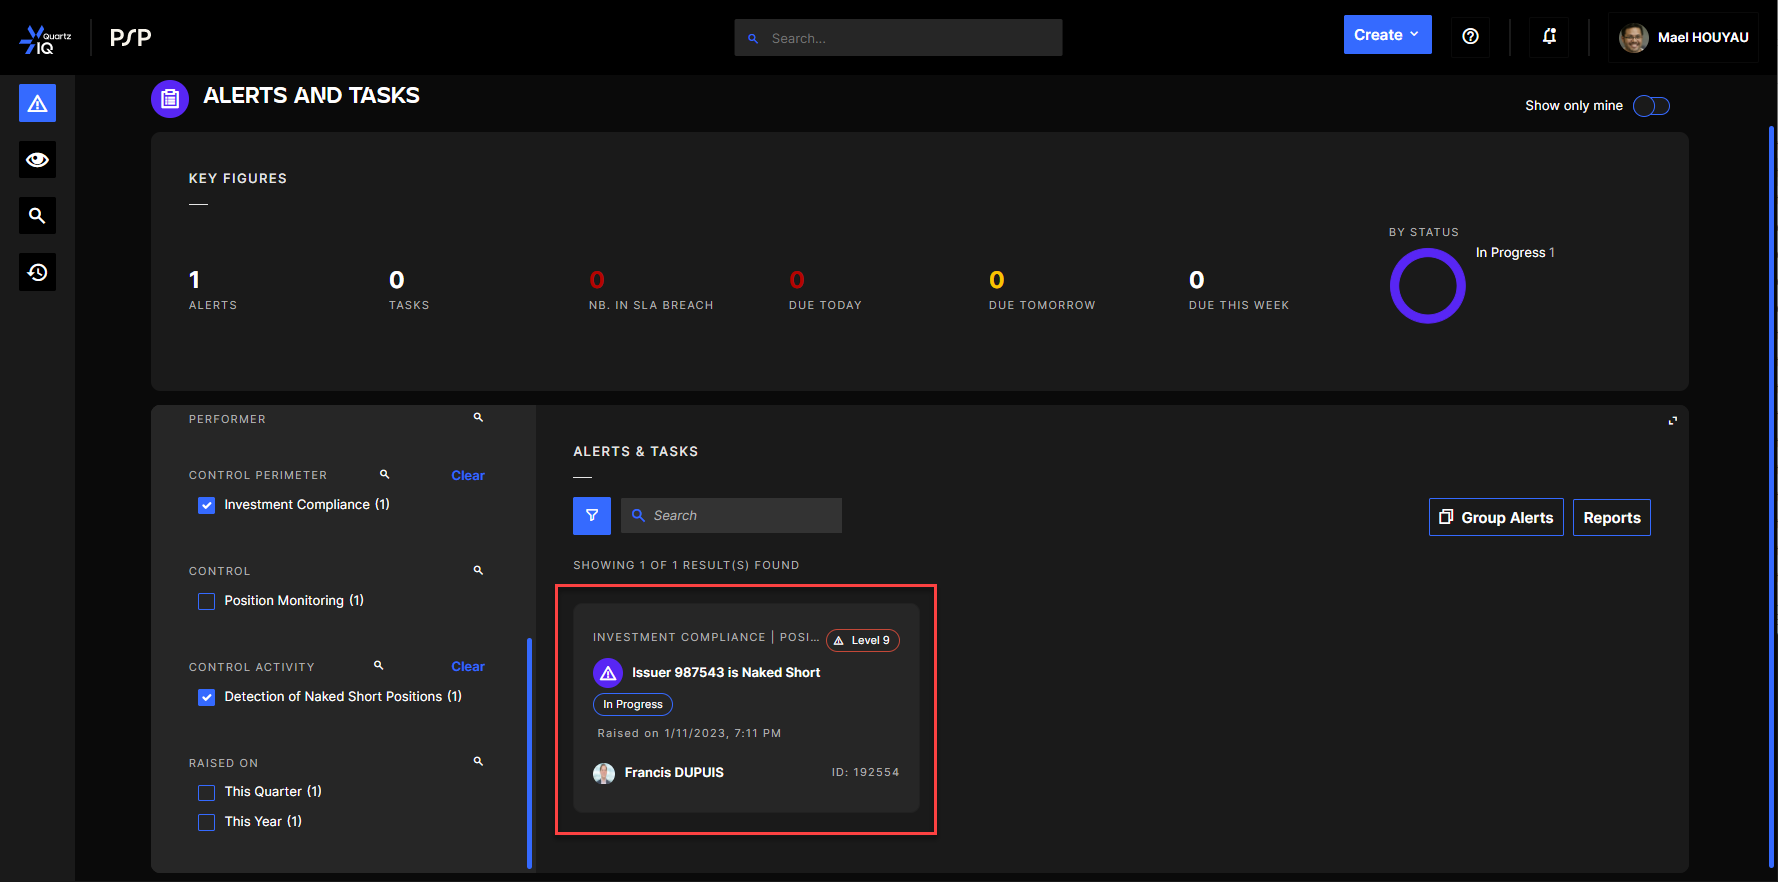
Alert Events are displayed within every Alert, to see more details on the Alert:
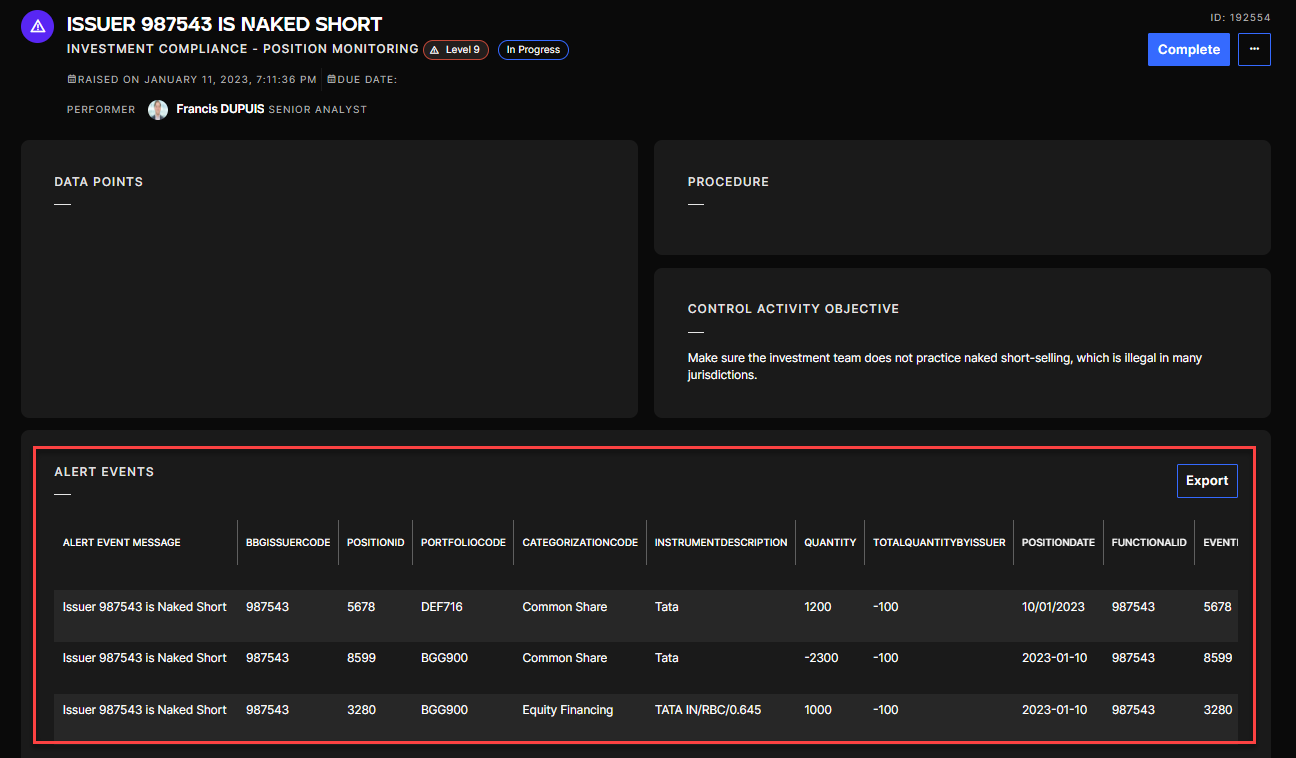
In the examples above, the column "BBGIssuerCode" was set as Functional ID and "PositionID" as EventFunctionalID. This means that you will have one Alert for each BBGIssuerCode, and each of these Alerts will have one Alert Event for each PositionID.
If there is no FunctionalID or EventFunctionalID in your query, you will see the results in the Alert Rule Preview, but nothing will appear once you execute the Alert Rule.
To have precise and customized information in your Alerts and Alert Events you must also define the Alert title template and Alert Event title template. Learn more on how to set these titles in the Control Activities article, "Create a Control Activity" section.
Alert rule examples
Imagine we have an initial data table named StockandSalesTable that has the following columns: Store, Product, CurrentStock, 2022Sales, 2021Sales, 2020Sales
Query 1
We want to know if some products are low in stock and in which store. The low stock limit can be fixed at 20 units.
To obtain this information, we can use this kind of SQL query:
StockandSalesTable
| where CurrentStock < 20
| project Store, Product, CurrentStock
| extend FunctionalID = Store, EventFunctionalID = Product
With this query you will obtain 1 alert per store in which one or multiple products are low in stock, and in these alerts, 1 event per low in stock product.
If you prefer to have 1 alert per product and only 1 event in each, you only need to change the FunctionalID to "Product" :
StockandSalesTable
| where CurrentStock < 20
| project Store, Product, CurrentStock
| extend FunctionalID = Product, EventFunctionalID = Product
Query 2
We want to know which store has realized more than 50% of the total last 3 years' sales of one or multiple products in 2022.
To find this information we can build a query like this one:
let 3YearsSales = 2022Sales + 2021Sales + 2020Sales;

let 3YearsSalesByProduct = StockandSalesTable
| summarize 3YSalesbyprod = sum(3YearsSales) by Product;

let 2022SalesRecord = StockandSalesTable
| join kind=inner 3YearsSalesByProduct on Product
| where 2022Sales/3YSalesbyprod > 0.5
| project Store, Product, 2022Sales, Last3YearsSalesByProduct  = 3YSalesbyprod
| extend 2022SalesRatioOver3Years = strcat((2022Sales/3YSalesbyprod) * 100,"%"), FunctionalID = Store, EventFunctionalID = Product;
2022SalesRecord
Let's break it down:
let 3YearsSales = 2022Sales + 2021Sales + 2020Sales;
1. Here we set a variable that add up the value of the columns 2022Sales, 2021Sales and 2020Sales for each row. We will be able to use this variable throughout the query.
let 3YearsSalesByProduct = StockandSalesTable
| summarize 3YSalesbyprod = sum(3YearsSales) by Product;
2. Here we create a new table that will aggregate the addition made in the previous let for each product. This table will only contain 2 columns: Product and 3YSalesbyprod
let 2022SalesRecord = StockandSalesTable
| join kind=inner 3YearsSalesByProduct on Product
| where 2022Sales/3YSalesbyprod > 0.5
| project Store, Product, 2022Sales, AllStores3YearsSalesOfThisProduct = 3YSalesbyprod
| extend 2022SalesRatioOver3Years = strcat((2022Sales/3YSalesbyprod) * 100,"%"), FunctionalID = Store, EventFunctionalID = Product;
2022SalesRecord
3. For the final part of the query, we first join the table created in part 2 to be able to use the quantity 3YSalesbyprod. Then we create a condition with where, to display only rows where the ratio of the 2022 Sales on the last 3 years overall sales by product is over 0.5 (50%) Finally we set the columns we want to see in the final results with project and extend. extend is used to separate the only calculated column from the other ones. The strcat() function is a concatenator that allows us to display the ratio as a proper percentage. As Store as been defined as the FunctionalID, you will obtain 1 alert per Store that has Products that match the criteria. The EventFunctionalID is set with the column Products, you will then see the details of Products that match the criteria in each Alert, with 1 Event per Product.
The final result will be:
| Store | Product | 2022Sales | AllStores3YearsSalesOfThisProduct | 2022SalesRatioOver3Years | FunctionalID | EventFunctionalID |
|---|---|---|---|---|---|---|
| Store 1 | Product 5 | 200 | 350 | 57% | Store 1 | Product 5 |
If you are looking for other functions, operators or statements to meet more specific needs, you can learn more with the Microsoft Documentation: Kusto Query Language (KQL) overview